stochastic momentum index
The stochastic momentum index (SMI) is a refined version of the stochastic oscillator that can provide traders with valuable information about an asset’s price momentum. The SMI incorporates a wider range of values and a greater sensitivity to closing prices, making it less susceptible to false swings and potentially more reliable than the stochastic oscillator. The SMI is often used to identify trends, look for divergences and generate buy/sell signals. Traders should use other technical indicators and analysis methods to confirm trading signals and to filter out false ones.
Developed by William Blau in 1993, the stochastic momentum index is an upgraded version of the stochastic oscillator. Like the stochastic oscillator, it uses a ratio of an asset’s maximum and minimum price range to create a momentum indicator that can help identify trend reversal points. But the SMI incorporates additional features, including overbought and oversold conditions, signaling crossovers and divergence.
In order to determine the overbought and oversold levels of the SMI, raw price differences are smoothed using a double exponential moving average. This produces a number that fluctuates between 0 and 100, with values above 0 indicating overbought and below 0 indicating oversold conditions.
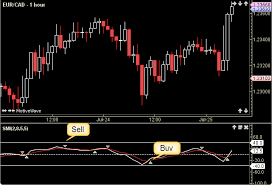
interpret signals from the stochastic momentum index in technical analysis?
When the SMI line crosses above the signal line, it is considered a buy signal and the market is likely to experience a bullish movement. Conversely, when the SMI line drops below the signal line, it is considered a sell signal and the market is likely to experience
Traders also watch for crossovers between the %K and %D lines of the SMI as signs of momentum shifts that could lead to reversals in the price trend. The SMI’s %K line can be made slower by increasing its period, but this may reduce the frequency of trade signals.
Divergence between the SMI and price trends can also be a useful tool for identifying potential trading opportunities. If the price is in a downtrend, but the SMI is showing higher lows than the price, this indicates that the market has entered a buying opportunity and it may be time to enter a long position. Conversely, if the price is in an uptrend but the SMI is showing lower highs than the price, this indicates that the trend is reversing and it may be time to enter a short position.
The Stochastic Momentum Index is a powerful tool on its own, but it can be enhanced by combining it with other technical indicators such as moving averages, which act as filters to eliminate false signals. The SMI can also be used in conjunction with volume indicators to see how much buying and selling pressure the momentum is carrying. However, it’s important to remember that the SMI is not foolproof and can produce false signals in choppy markets. Therefore, it’s a good idea to use the SMI in conjunction with other indicators and to always trade cautiously.